

The Toronto and area residential resale market limped to the end of 2022, a continuation of the pattern that became clear and established as interest rates began to rise in March of this year. As the Bank of Canada continued its punishing benchmark rate hikes, both sales and average sale prices have been decimated. Once again, no surprises in December.
Here is what has happened to sales since the Bank of Canada commenced its rate hikes in March.
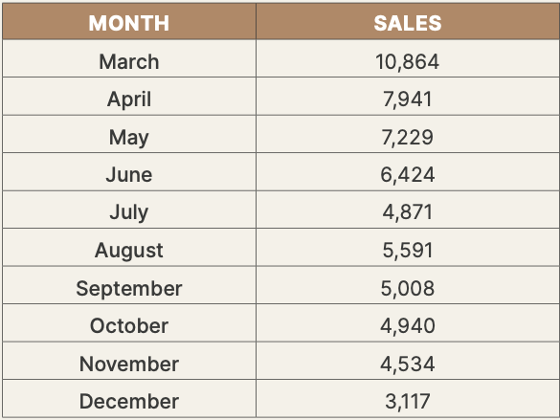
December’s sales results were more than 48 percent lower than the 6,013 properties reported sold last December. Since March the number of monthly sales has decreased by more than 70 percent. It should be noted however, December’s sales results have historically been the lowest in any year.
The trajectory of average sale prices in Toronto and area has been similar to monthly sales.
Last December the average sale price was $1,157,877. December 2022’s average sale price is almost 10 percent lower than last year. More significant is the dramatic tumble in prices since March. At the end of the year, prices are $247,455, or almost 20 percent, lower than they were in March. In the City of Toronto, primarily due to the preponderance of condominium apartment sales, the average sales price was even lower in December, coming in at $1,015,000.
The underlying driver responsible for the current market place is affordability. Even with a 20 percent decline in average sale prices since March, the even more accelerated rise in mortgage interest rates has made Toronto and area homes unaffordable, extremely unaffordable. A recent study by the National Bank has indicated that even with Toronto and area’s alarmingly lower average sale prices affordability is beyond the reach of all but a small number of buyers.
The National Bank reports that a mortgage on a typical home now takes up to 67.3 percent of a household’s income to service, the highest level of debt service since 1981. The Bank’s analysis indicates that to own a non-condominium home in Toronto, households need an annual income of $273,549 and many months of savings in order to have sufficient down payment funds to afford a “representative home” priced at $1,351,000. In December the average sale price for detached properties in Toronto was $1,627,000. Semi-detached properties came in at $1,162,000. For a representative condominium apartment, priced at $738,000, households need $174,466 in annual income. The average household income in Toronto in 2022 is approximately $105,000. That’s about $70,000 less than the price of a “representative” condominium apartment and almost $170,000 less than a “representative” freehold home. In December, the average sale price for condominium apartments in the City of Toronto was $741,584.
There is no good news in December’s resale data. Not only are sales and prices falling, but further declines can be expected. Unaffordability has forced even would-be buyers to downscale their expectations based on their ability to qualify and then service the debt that they will be assuming. As a result, gone are the days when Toronto and area’s average selling price exceeded list prices by as much as 120 percent. In December all properties reported sold came in with a sold price of only 98 percent of the asking price. In the City of Toronto it was lower at only 97 percent. In some trading areas, ratios were even lower. Even Toronto’s powerful eastern trading districts, which have not seen sales to list price ratios since 2008 below 100 percent came in at 99 percent.
Active available properties have increased over the last few months, a common result of declining sales but not excessively. In December there were 8,692 apartments, detached, semi-detached, and townhouse available to buyers, 169 percent more than the 3,231 active listings available last December.
Even though 2022 started with three strong months, January, February and March, the total number of annual sales was dismal. Only 75,140 properties changed hands, even less than the 78,017 sales reported in 2018 when legislative changes brought the resale market to a halt. Beyond 2018 its necessary to go back almost two decades to find a year when sales were as low.
Given the co-relation between mortgage interest rates, sales, average sale prices and affordability the immediate future of the Toronto and area residential resale market is self-evident.
The market will remain sluggish well into 2023, especially since the growth in Canada’s employment numbers will lead the Bank of Canada to further benchmark rate increases. Average sale prices will continue to decline. Unfortunately, buyers are constrained by a lack of affordability given the prevailing economic factors. Buyers simply can’t pay what sellers expect (hope?) to achieve for their properties, which ultimately will have the concomitant effect of bringing prices down.
There is no way of determining how low average sale prices must fall – it would be easier to forecast if the Bank of Canada’s position on rates was final – but a further 10 percent decline from December’s average sale price of $1,051,000 is a reasonable estimation. It won’t be until the beginning of the later half of the year, and perhaps even the end of 2023, when the residential resale market begins to show signs of growth. Growth but not a return to the halcyon days of the pandemic market. The Bank rate would have to return to 0.25 percent, an impossible likelihood.


